The spike in inflation and movement away from COVID restrictions marked the beginning of the end of the white-hot housing market. At the end of 2021, inflation began to rise, and the economy became less reliant on the easy monetary policy the Fed implemented to incentivize spending. This time last year, interest rates were near all-time lows, so whether you were a company issuing debt or a homebuyer taking out a loan, the inflation-adjusted cost of financing was next to nothing. From 2000 to 2020, inflation averaged around 2.1% within a tight range. Even if you lived through the highest inflationary period in U.S. history during the1970s, it’s very unlikely that you can relate to that period now after decades of low inflation. Along with the day-to-day added costs of inflation, the stock market, which is often the largest store of liquid wealth, felt the pain of inflation and economic uncertainty in 2022, now down about 18% on the year as of the end of October.
From February 19, 2020 (the pre-pandemic S&P 500 peak), to January 3, 2022 (the current peak), the S&P 500 grew 42%. If you happened to be an exceptional (read: lucky) market timer and bought the S&P 500 during the early COVID dip on March 23, 2020, then your investment would have been up 114% through January 3, 2022. All this to say, the equity markets boomed in 2020 and 2021, which is a natural byproduct of having more money with less to spend it on. If you didn’t buy a house last year at a historically low interest rate or didn’t take some profits in your financial portfolio at the beginning of last year, you may be (or, at least, feel) less wealthy. The idea is pretty straightforward: When you feel richer, you spend more, and vice versa. People, in general, are not great at looking far into the future or the past, so when conditions quickly change, it’s noticeable. Because economic conditions are moving less favorably, the pain of what we lost out on is experienced more strongly. (This is something called “loss aversion bias.”)
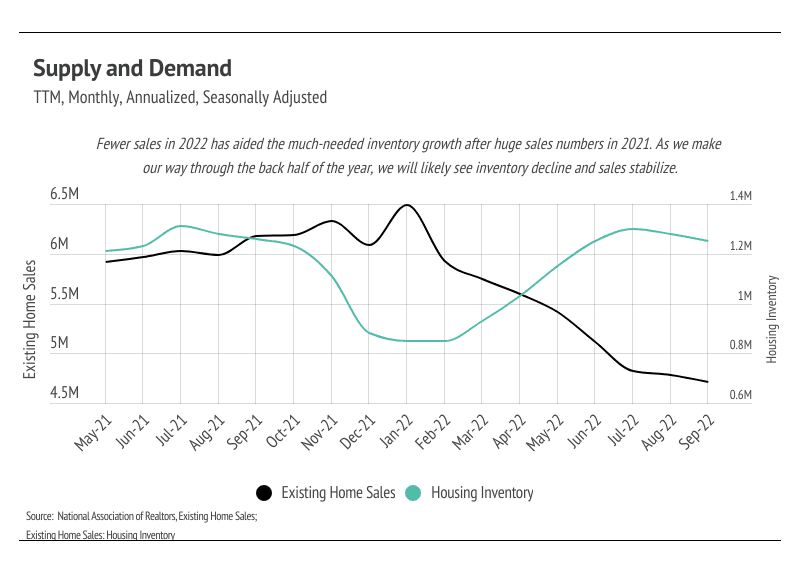
Just about every economic indicator points to a slowdown in home sales, which is exactly what’s been happening. We can attribute the slowdown to three main factors: the Fed implementing tighter monetary policy (higher interest rates and no longer purchasing Mortgage Backed Securities), mean reversion, and seasonality.
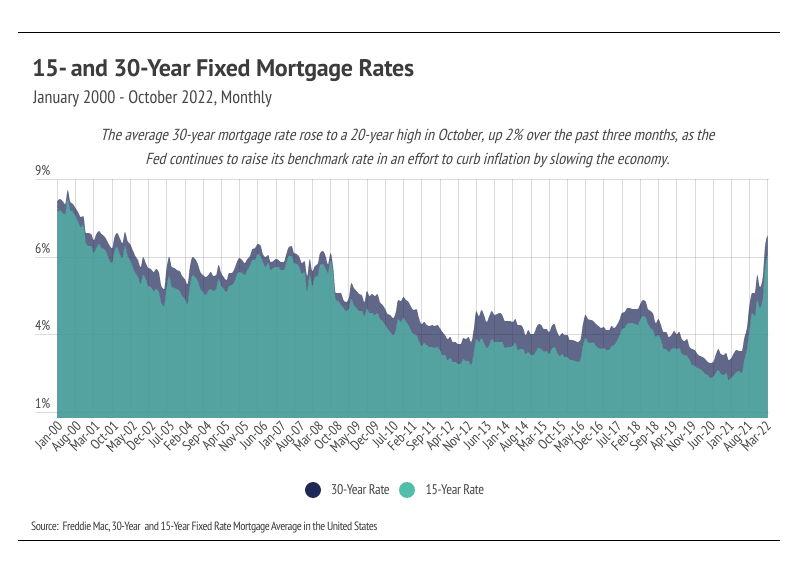
The Fed doesn’t have many tools to fight inflation, so they’ve been using the one they have, which is raising the effective federal funds rate (EFFR), which indirectly affects the rest of the financial markets. The Fed has increased the EFFR 3% this year to 3.08% — its highest level since 2008 — in an effort to combat inflation. The average 30-year mortgage rate has more than doubled in 2022, moving from 3.11% to 7.08% by the end of October 2022, which marks a 20-year high. If you financed a home at any point last year and had good credit, your mortgage rate was probably around 3%, which means that if you had gotten the same loan at 7%, your monthly payment would be 58% more expensive. Said differently, if you could afford a $500,000 home last year, you can only afford a $350,000 home now.
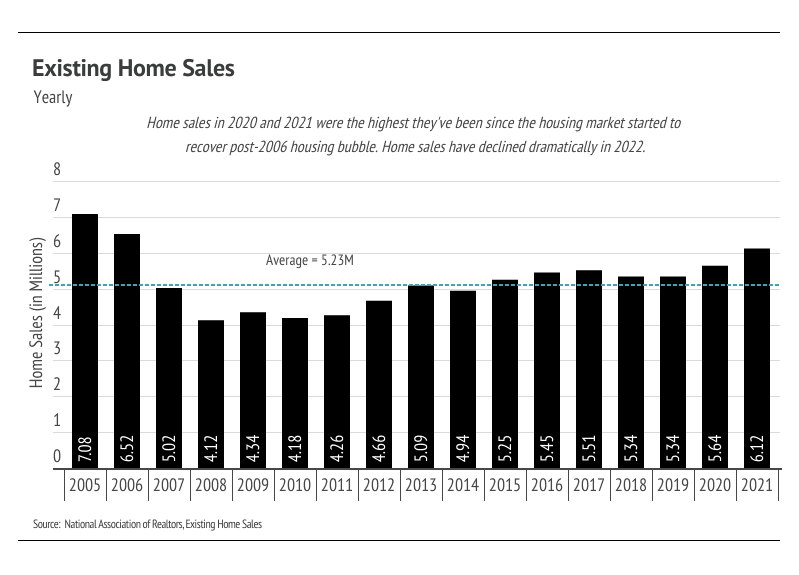
Mean reversion, which is the idea that over the long term, prices will tend to converge around the mean (average), can also apply to home sales. Homes aren’t bought and sold over and over in short time frames. The number of sales in 2021 was nearly 800,000 higher than the 10-year average, so it stands to reason that sales in 2022 would drop by around that much, especially considering the less favorable market conditions. We can finally say that the market is cooling, but after the hottest two years since the mid-2000s, cooling indicates a healthier market.
Lastly, the housing market has seasonal trends during which home prices and inventory generally rise in the first half of the year and fall in the second half. We can ascribe some causality for the drop in inventory and prices to seasonality, even though other factors are at play.
The U.S. housing market has certainly shifted over the past several months, and although we hate to sound doom and gloom, we must recognize the current conditions homebuyers and sellers face. So is this the new normal? It’s looking very likely. Of course, different regions vary from the broad national trends. Take a look below at the Local Lowdown for in-depth coverage of your area. As always, we will continue to monitor the housing and economic markets to best guide you in buying or selling your home.
Big Story Data
The Local Lowdown - San Francisco
-
San Francisco’s housing market is experiencing a period of little to no growth, which is common after rapid gains like we saw in 2020 and 2021.
-
Sales rose as new listings declined, a trend that will likely continue to drop inventory further as we enter the holiday season.
-
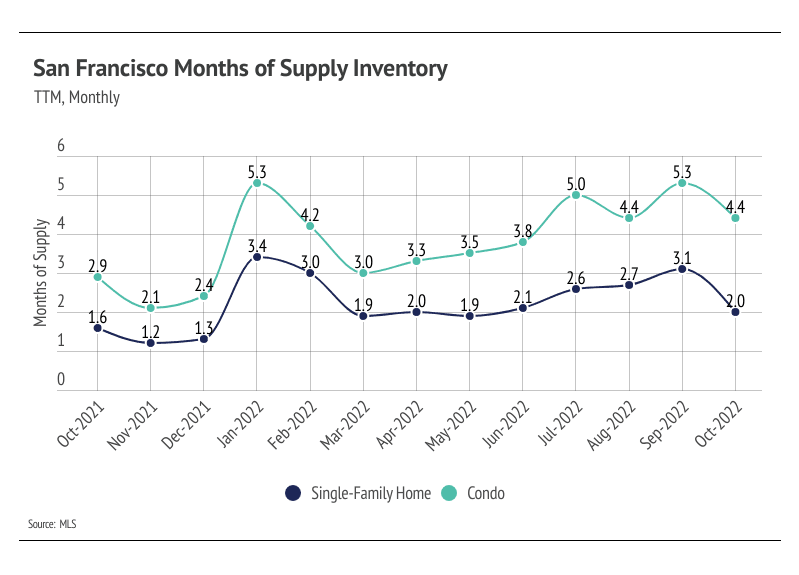
Months of Supply Inventory dropped in October, implying that the single-family home market moved back toward a sellers’ market, while the condo market still favors buyers slightly.
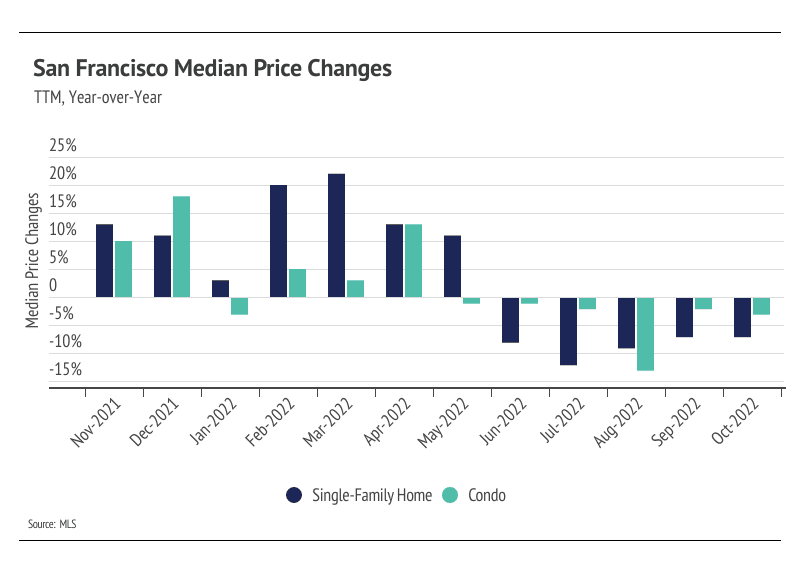
Prices may contract further before reversing
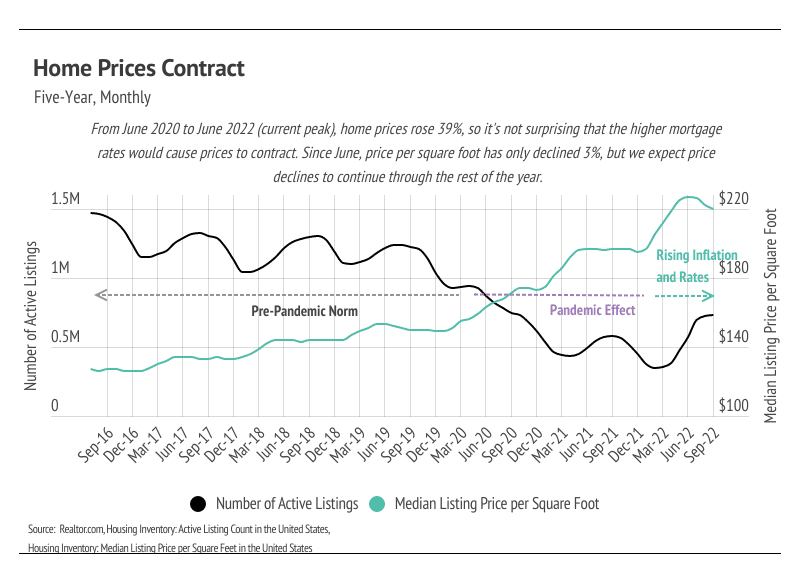
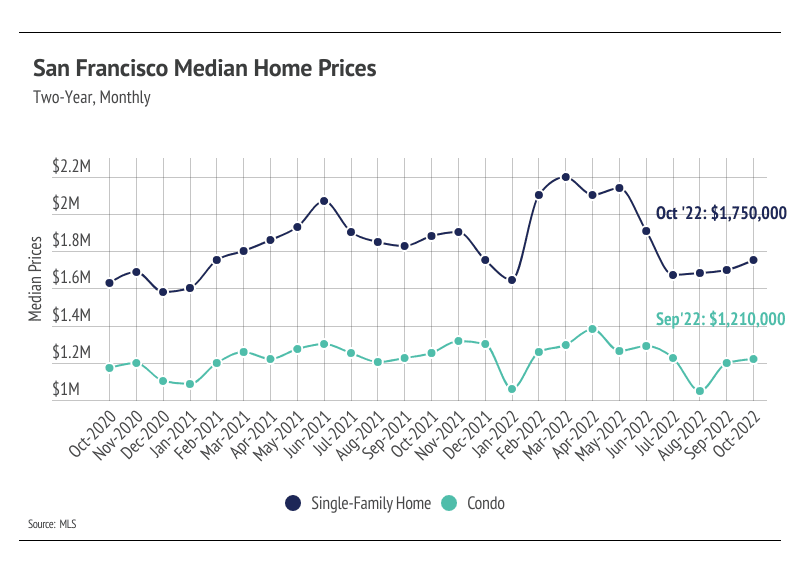
We have enough data to show that the housing market in San Francisco is cooling substantially after one of the hottest real estate markets in history. Of course, you don’t have to be a real estate expert to realize that when interest rates shoot up, fewer buyers will be in the market, which generally puts less upward pressure on prices. Single-family home prices have declined 22% from the March peak, but having risen 35% in the 18 months before the peak, they’re still up 6% over the past two years. Condo prices rose in September and October after a 24% decline from the April high, bringing the total price appreciation over the past 24 months to 4%. Moving forward, prices will likely contract slightly more through the rest of the year, which is typical during the slower holiday season. Home prices in San Francisco grew at an unsustainable rate in 2020 and 2021, and a contraction is a normal response to that sort of growth. We are now entering a stage of slower longer-term growth — but still growth. In the short-term, prices may come down a little more, however. Real estate has shown itself to be one of the best investments in recent history and is, on average, the largest store of wealth for an individual or family. Price appreciation will likely move to a more normal growth rate of around 5-6% in the coming years, which makes for a much healthier market than what occurred in 2020 and 2021.
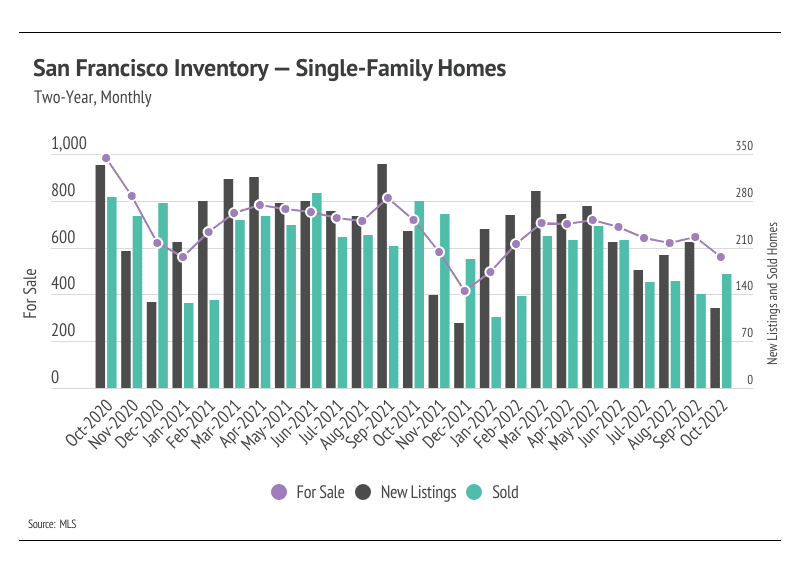
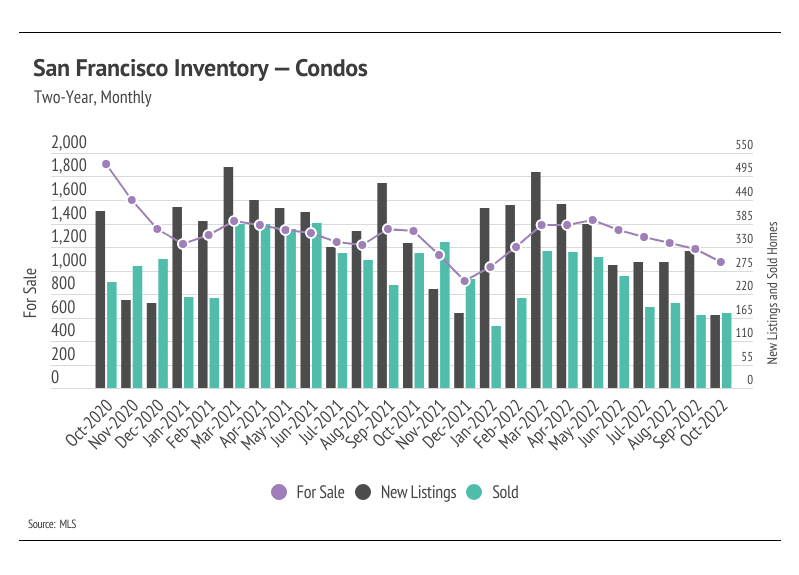
Sales increase while new listings decline, dropping inventory further
Single-family home and condo sales rose 13% month-over-month, while new listings declined significantly, down 44% from September to October. We expect sales to remain slightly elevated in November and December, while new listings decline, dropping inventory lower. Both sales and new listings have been depressed in 2022. Now that we’re through most of the year, we can see just how significant sales were in 2021 by comparison, especially in the summer months. From May through September of last year, 2,815 single-family homes and condos sold. During the same period this year, 2,051 homes sold, a 27% decline. Far fewer new homes have come to market in 2022, and the rising rate environment has dropped demand as well. We can tie new listings not only to supply, but also to demand, because sellers are often buying, too. Softening demand has brought the market closer to balance despite declining inventory.
Months of Supply Inventory implies a balanced market
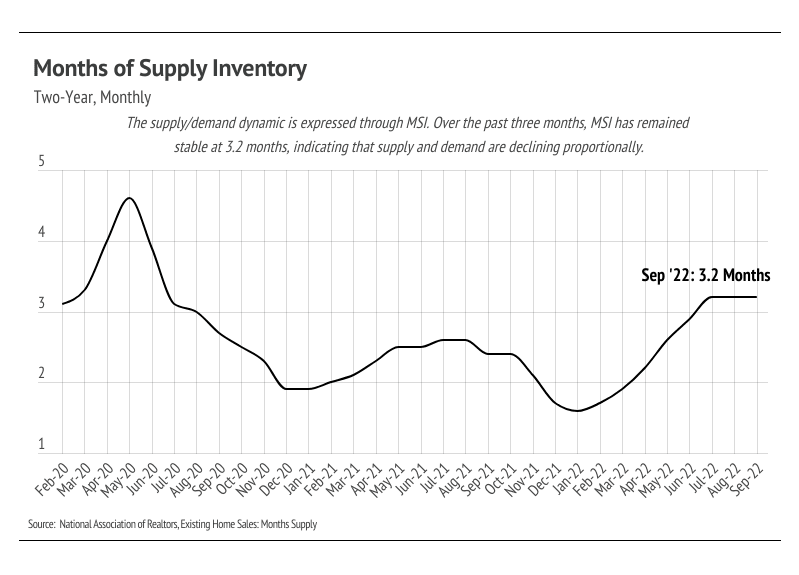
Months of Supply Inventory (MSI) quantifies the supply/demand relationship by measuring how many months it would take for all current homes listed on the market to sell at the current rate of sales. The long-term average MSI is around three months in California, which indicates a balanced market. An MSI lower than three indicates that there are more buyers than sellers on the market (meaning it’s a sellers’ market), while a higher MSI indicates there are more sellers than buyers (meaning it’s a buyers’ market). MSI has trended higher (from a sellers’ market toward balance for single-family homes and from balanced to buyers’ for condos) since the spring. Despite a less-favorable economic environment, the drop in inventory and increase in sales caused MSI to fall in October, a trend that will likely continue through the winter.
San Francisco Data
The Local Lowdown - North Bay
-
The North Bay housing market is experiencing a period of little to no growth, which is common after rapid gains like we saw in 2020 and 2021.
-
Sales and new listings are declining, a trend that will likely continue as we enter the holiday season.
-
Months of Supply Inventory indicates the market is shifting from a sellers’ market toward a balanced market for single-family homes and condos but remains a sellers’ market.
Prices may contract further before reversing
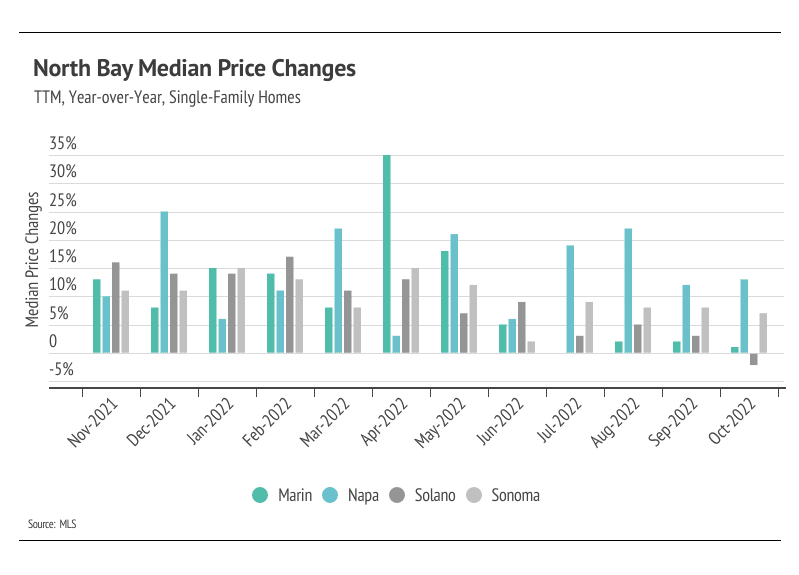
We have enough data to show that the housing market in the North Bay is cooling substantially after one of the hottest real estate markets in history. However, demand in the North Bay is somewhat evergreen. People simply always want to live here. Of course, you don’t have to be a real estate expert to realize that when interest rates shoot up, fewer buyers will be in the market, which generally puts less upward pressure on prices. Single-family home and condo prices have declined from their peaks reached earlier this year with the exception of Napa condo prices, which reached a new all-time high and is likely a statistical outlier rather than the start of a new trend. Moving forward, prices will likely contract slightly more through the rest of the year, which is typical during the slower holiday season. Home prices in the North Bay grew at an unsustainable rate, and a contraction is a normal response to that sort of growth. We are now entering a stage of slower longer-term growth — but still growth. In the short-term, prices may come down a little more, however. Real estate has shown itself to be one of the best investments in recent history and is, on average, the largest store of wealth for an individual or family. Price appreciation will likely move to a more normal growth rate of around 5-6% in the coming years, which makes for a much healthier market than what occurred in 2020 and 2021.
New listings decline faster than sales, dropping inventory further
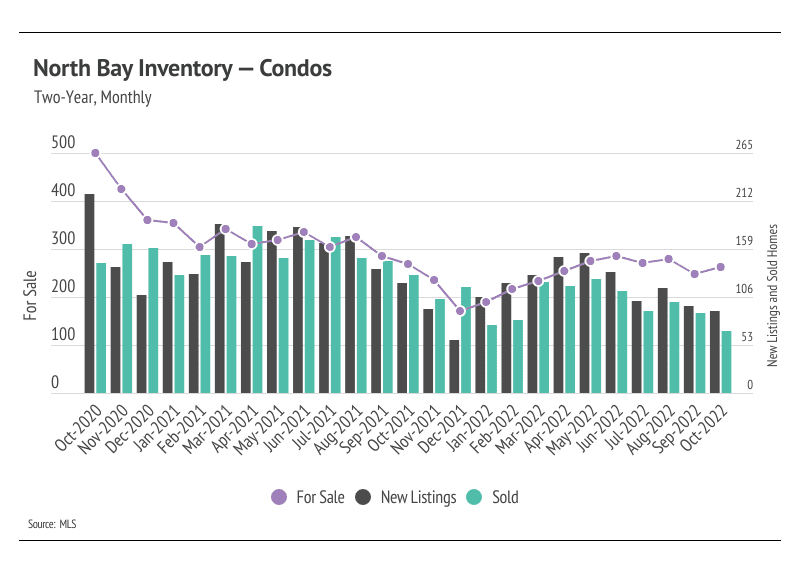
Single-family home and condo sales and new listings declined month-over-month, a trend that will likely continue through the rest of the year. The North Bay, along with the rest of the country, has not returned to pre-pandemic inventory levels after the buying boom last year. Now that we’re through most of 2022, we can see just how significant sales were in 2021 by comparison, especially in the summer months. From May through September of last year, 7,457 single-family homes and condos sold. During the same period this year, 5,341 homes sold, a 28% decline. Far fewer new homes have come to market in 2022, and the rising rate environment has dropped demand as well. We can tie new listings not only to supply, but also to demand, because sellers are often buying, too. Softening demand has brought the market closer to balance despite declining inventory.
Months of Supply Inventory implies a balanced market
Months of Supply Inventory (MSI) quantifies the supply/demand relationship by measuring how many months it would take for all current homes listed on the market to sell at the current rate of sales. The long-term average MSI is around three months in California, which indicates a balanced market. An MSI lower than three indicates that there are more buyers than sellers on the market (meaning it’s a sellers’ market), while a higher MSI indicates there are more sellers than buyers (meaning it’s a buyers’ market). MSI has trended higher (toward balance) since the spring due to the changing market environment. However, we are still in a sellers’ market, as demand for homes has remained high relative to supply.